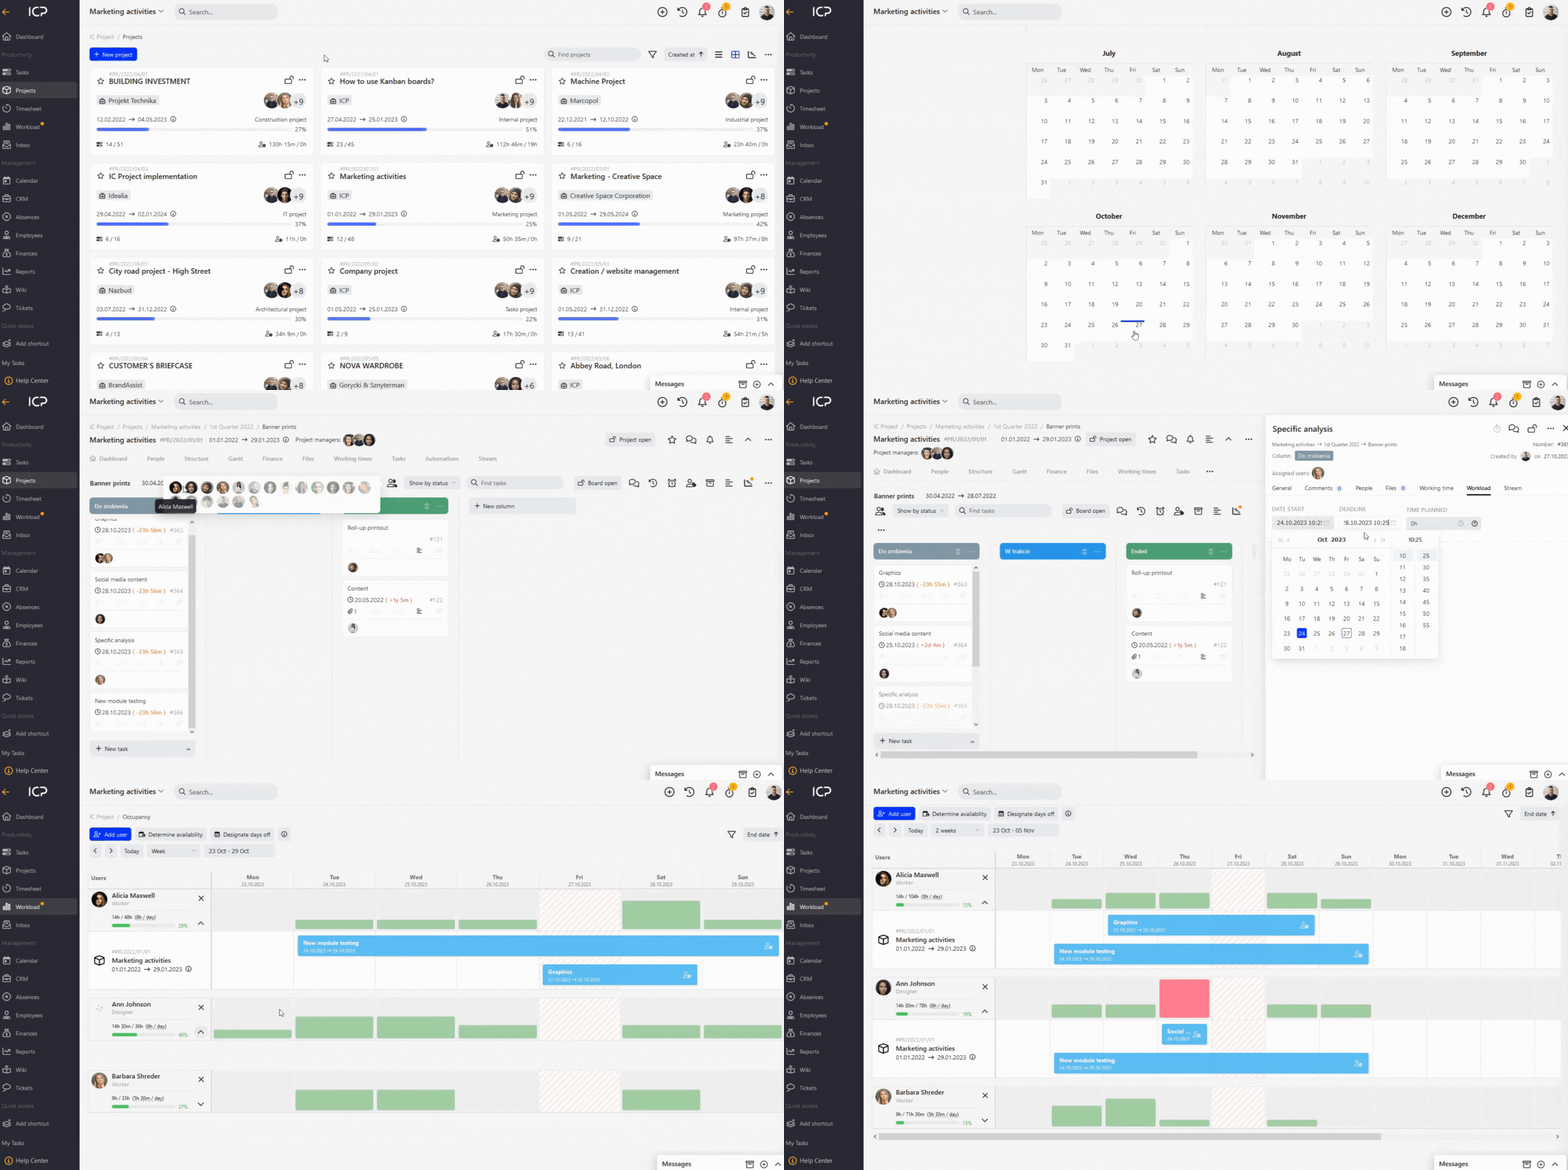
We’ve been keeping it under wraps, working on it for several months, and finally, the moment of release has arrived ? Introducing our latest workload module, located in the central part of your left-hand menu ❗
The new workload module is a one-stop planning centre for your entire team. Here you will plan your workload for weeks to come, with the entire team workload shown in visual graphs for each user. All this so that your plan is even perfectly prepared ?
The system will visualise in graphs how heavily loaded each employee is by day. This makes it easy to spot when an employee has been over- or under-worked. The special colours in the graphs make it easy to draw conclusions at a glance, and the development of each graph shows what the specific workload is due to. Each user chart has been linked to a special timeline with the tasks that affect the workload in a given period. Sound good? ?
In order to start using the workload module effectively, you need to know at the start and to take care of some important steps to follow. This will allow you to define some important information to get started, as well as familiarise yourself in detail with how the entire module works ?
1. Explore the workload module and additional options from within it.
To begin, go to the workload module from the left-hand menu, add selected users to manage your workload and take a peek at the top of the entire module. Here you will notice special buttons that will allow you to determine the availability of your entire team and designate days off for your entire company. This will allow you to plan your work efficiently, and calculate occupancy in visual charts ?
? You probably won’t see charts or tasks in the workload module at first, because for this you need to follow the steps below. As long as you specify the availability of the selected users, and schedule the working time on a task for these users, the graphs will automatically show the corresponding values. Start with this and you will get into the details of the entire module in no time.
2. Determine user availability and days off in the company.
In the second step, determine the daily availability for each user, i.e. how much time they realistically have available. We are prepared for the situation that even each employee may have a completely different availability. Enter the appropriate amount of time for each at a time, which is a standard working day. In addition, designate days off for the entire company. This is an essential element, as every day off will be excluded from the calculation of occupancy (because, after all, that’s when you don’t work! ? ). You do it once, and you’re done ✅
? You can also manage the availability of individual users from the entire workload module. As long as you add them on the module itself, you will see their standard daily availability on the left-hand side, as well as the percentage of load relative to the view you currently control. Simply click on the daily availability on the left-hand side and the system will (if you have the necessary permissions to do so) allow you to change it. When designating days off, you can use the default days option. This is great for, for example, quickly marking all weekends on the calendar, and these will be the days automatically marked as free throughout the year. This reduces the number of clicks to work even faster.
3. Plan working time on tasks for selected people.
In the third step, start planning the working time on tasks. In order for the occupancy to be shown in the charts, you must assign the relevant people to the tasks and then go to the new ‘Occupancy’ tab at task level. Here, you specify the time planned for the task as a whole, but above all for each of the employees carrying out the task. If you enter the relevant time per job for this task, note also the duration of the entire task (when it starts and when it is due). This is important information because the occupancy will be evenly distributed in relation to the task duration interval, and the scheduled time ⏰
? Scheduling a time for a person is necessary to get that person’s occupancy chart working and to represent the level of load. On the time task, you can schedule the overall time for the entire task, but pay attention to allocate these hours to each person. Pay your attention to the time frame of the entire task, as this will be a key condition for our algorithm. If the start date of your task is defined as, for example, 25.10.2023 and the due date is 29.10.2023, the system will indicate that the task lasts a total of 5 days (duration interval, from-to). Our module’s algorithm will recalculate the scheduled time for the selected user, by the duration of the task (from-to) and confront it with its specified availability.
4. Go to the workload module and start exploiting its possibilities!
At the end of our operating chronology, simply visit the workload module and control the entire workload of your teams in visual charts. This is the place not only to control the work plan, but also intuitive in making any changes. If you expand each user’s chart, you will see a capitalized timeline that all tasks affecting specific load bars. You can easily change the plan, for example by dragging a task, expanding or collapsing its dates. It’s a complete command centre! ?
? The workload module is a full combination of charts, but also a special timeline with tasks. Pay attention to the permission level as well, as access to the entire workload module is currently available to people with full project management capabilities, but also to project managers on selected projects. Go to permissions and check on the selected role for access to the workload module.
If you want to take advantage of even more opportunities to manage your work, check out the additional options for filtering your data. By finding this icon in the top right-hand corner of the module, you can easily show tasks that not only have a scheduled time, but simply all falling for a given user within a won time range. There are also free views to use (weekly, 2-weekly, monthly and even 2-monthly!) and automatic sorting of tasks by what is most important, i.e. projects ?
Click here to go to our support centre and read more about how the entire workload module works in detail.
PS. We absolutely do not stop there. This is the module we are giving away for you in the premiere version, but we will be adding more possibilities in a short while, and supporting the intuitiveness of your work using our total novelty. We look forward to your feedback! It’s a key piece in our whole puzzle ?


