A Gantt chart is a concept that is often not very clear, and one that scares many people at various meetings. Unjustifiably so, because a Gantt chart is most simply a tool that visually depicts a timely plan for the entire project. It is an extremely effective project management solution that shows the structure of a project, as well as its time plan on a timeline. Thanks to this tool, you will get a complete and transparent Gantt chart, which will allow you to better manage your work, control the progress of tasks and also make any corrections quickly.
Gantt chart – how was it created?
The creation of the Gantt chart has a very interesting genesis, as many facts indicate that the creator of the Gantt chart is… Polish. The forerunner of the visual representation of the project was Karol Adamiecki, who created the first tool of this type in 1896. Unfortunately, he didn’t decide to publish his work until 1931. That’s a pity, because we probably wouldn’t be writing about a Gantt chart nowadays, but perhaps about an Adamiecki chart. In the end, however, it is Henry Gantt who is officially identified as the creator of the visual design schedule and it is the American who is credited with creating the tool. This occurred in 1910, when Gantt developed the method for the Benthlehem Steel factory and published a paper in Engineering Magazine.

Since then, the Gantt method has revolutionised project management and offered a much more transparent and visual way to manage project timeliness. Prior to the discovery of Gantt, projects were laid out on sheets of paper, yet this method had lost its effective use. As each project became more complex and advanced, new solutions had to be found, and the Gantt chart became one of them. The method of visualising a project on a timeline was loved by project managers, as well as those who only participated in projects at a task work level. As you can see, the origin of the chart dates back more than 100 years ago, and the whole method is still in its heyday and there is hardly a project manager who could imagine working effectively with a complex project without a schedule.
How to create a Gantt chart?
This is undoubtedly a good question, while in this case we can detail several popular solutions. First of all, let’s start with the method that de facto began the history of working with a schedule, which is to say, further paper. Let us remember that the schedule in 1910 was not visualised using technology, but was just a new and different way of visualising the entire project. Years ago, the activities in a project continued to be written out on pieces of paper, while the Gantt chart offered a different way of visualising it.
In this case, a piece of paper, some colours and a range of activities can provide the basis for already starting to work with a project schedule. Of course, we do not recommend this solution, because in the 21st. Century we have many others, much more effective. However, we had to mention what Gantt de facto started with. In mundane situations, this can be the solution used for a preliminary schedule, for example.
By far the most effective tool for Gantt scheduling is a special programme to manage projects more effectively. We use what we have these days, which is technology. Let’s take IC Project as an example, which is a project management tool. When we add a new project in this programme, we have to detail the basic stages or individual tasks. However, we do not have to worry about the scheduling process itself. Why? Gantt chart in this case is created automatically by the tool’s algorithm. This is a huge convenience because we don’t need to write out our project visually – we use the structure of the tool, adjust the process and see what we want to see.
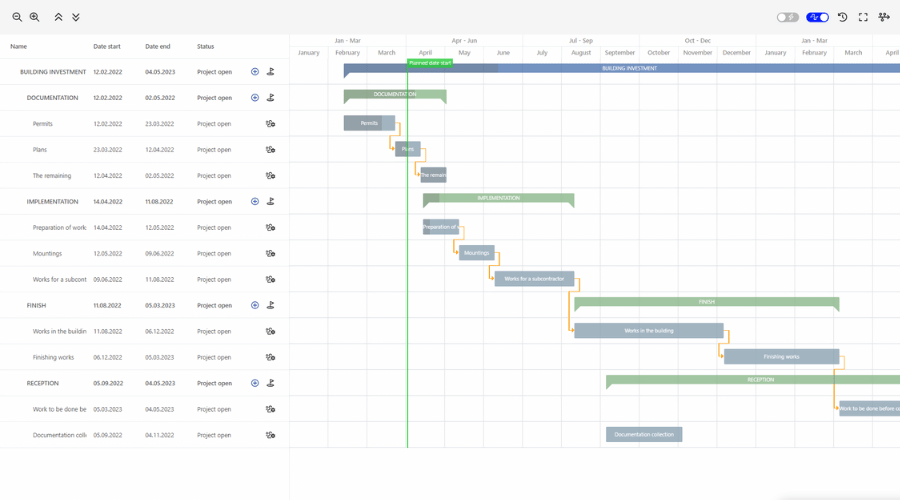
If, on the other hand, we already have a project with a schedule in a tool such as IC Project, we see the structure of the project (stages + tasks or even individual parts of the project), with a full visualisation on the timeline on the right. The tool highlights the structural parts of the project in colour. For example, the green section is the whole project, the blue sections are stages and the grey blocks are groups of tasks. All project processes are superimposed on the timeline, allowing you to instantly check the timeliness of the entire project. Also bear in mind that this is a dynamic schedule.
What does this mean? This is a huge advantage of the technology, because from the Gantt chart we can change the timelines straight away. For example, we want to set initial deadlines for particular milestones, we do that straight away on the chart. If, on the other hand, there is a need for change, we can also change everything from the chart, and all changes will be updated for the entire project. This is a great asset because we know what the project timelines represent in real time. As in many aspects of our lives, technology is the key to success – also in creating a Gantt chart.
What steps do you need to follow to make a Gantt chart effective?
- Add a project and set a deadline.
Without a project there is nothing to look for, the Gantt chart is a visualisation of what we will create. If we use the tool, we have specific steps that need to be completed for the project to be added. In general, the name of the project, together with the start and end dates, are the basic conditions to be met in order for the Gantt schedule to start functioning in a simple, condensed formula.
2. Build the project structure.
What do we mean by the statement project structure? Depending on the level of advancement of the project, it can be broken down into individual tasks, task groups or even phases. In short, a project is a general statement and must always be broken down into smaller activities to be done. Whether these will be phases or tasks, the decision remains with the project manager. Remember that it is in the Gantt chart that these smaller parts will be visualised.
3. Adjust the timelines for the smaller activities of the project.
If you build a structure, each of these activities must have a time frame. It is not only the project that is constrained by start and end dates, and even the smallest task. This is what all project-task methodologies point to. Depending on how you divide the project into elements, you must also adjust the timelines for them. Thereby, you will immediately see a detailed visualisation of the timeliness of the entire project on the timeline, i.e. on your schedule.
4. Determine the relationship.
What are relationships? They are the timely connections between the designated activities of your project, on tasks or stages. With the use of technological dependencies, you automate the process of delaying a certain activity its impact on the rest of the deadlines in the project, logistics-wise. If you make the activities appropriately dependent on each other, changing the deadline of one activity will automatically affect the rest of the deadlines. This is a key function of a Gantt schedule for any successful project manager. Relationships may informatively indicate connections, but with the use of a tool like IC Project they will instantly update the further progress of the project.
5. Define milestones.
A milestone is a point at time zero that signals an important situation on a project. It is usually a point of information that sends a very important message to those running the project. A milestone has a specific point in time, it can represent a customer decision, a checkpoint or a moment of completion of important project activities.
6. Control deadlines and make quick changes!
A Gantt chart is a tool that will allow you to effectively control the entire timeliness of a project – from its full scope to individual tasks. So if you need to make changes (there is no such thing as a project that runs according to plan from start to finish!), make them right from the chart. This is a huge advantage for real-time project management.
In summary… why is it worth using a Gantt chart?
Gantt chart is a near-perfect tool for visual project management. It is a must-have method for project work. There are many ways to create schedules – from the traditional paper one to the most effective project management tools. Using IC Project, each project will receive an automatically created Gantt chart, which will show a properly constructed project in a different, and at the same time transparent, view.
If you want to run a project according to plan, Gantt schedule is definitely the most effective solution. Among other things, this solution will allow you to easily adjust deadlines on parts of your project, control the entire workflow, and react quickly to potential changes. Switch to the Gantt chart in IC Project and explore the possibilities.