Update 01/2023: We sum up January!
The new IC Project system has become a reality. It's total cutting-edge technology, the best UX standards and, above all, a lot of essential functionality that...

Tell our team about your needs and we will customize the tool as part of your chosen package!
The new IC Project system has become a reality. It's total cutting-edge technology, the best UX standards and, above all, a lot of essential functionality that will make your work even more organised. In this blog post, we come to you with a summary of the first month in 2023, January. At the very beginning of the year, we have already managed to introduce many new features based on your feedback. Did we hit your needs this time? Let's check out what's new in January at IC Project.
We have introduced visual and customisable financial charts in the project finance module! ?
The finance module in IC Project has been enhanced with excellent financial charts that allow you to analyse all your financial data in real time. All you have to do is navigate to the project of your choice and then hit the Finance tab. Here you will discover four visual financial charts that guarantee a totally different level of data analysis. You can select whatever you want to analyse at any given time. When designing the charts, we focused on a very high degree of flexibility, as well as the comprehensiveness of the data. As a result, we have included in the charts all the data that the financial module in IC Project has.
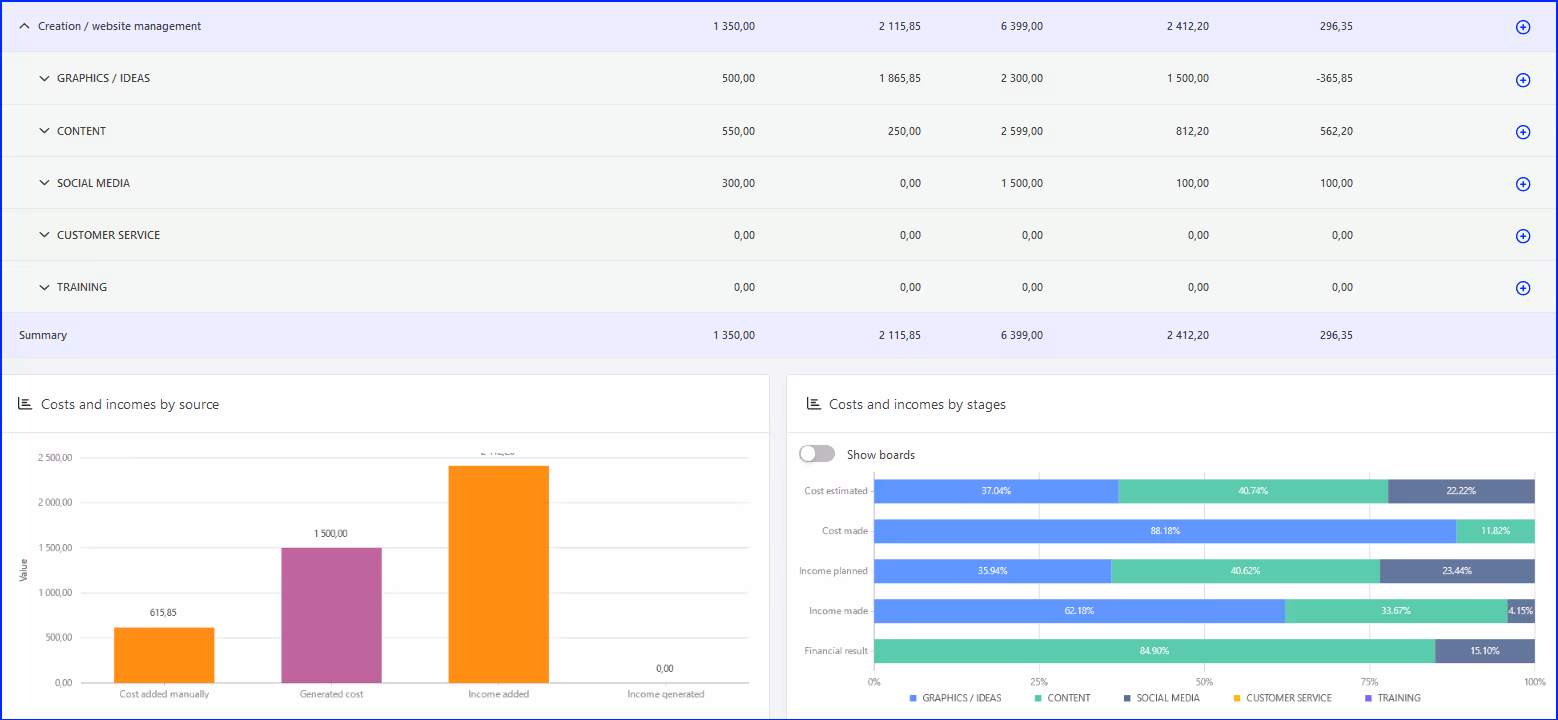
In the financial module, we have implemented four charts - two above the financial values on the project structure and two below. The first two charts are about controlling costs and financial performance, and are fully customisable. You can set a timeframe, the data to show and even control the charts in full screen. You click on the variable of your choice at the bottom and it shows or hides in the chart. We are committed to making each chart as intuitive and transparent as possible for you. This you can definitely achieve without too much effort, with just one click.The charts below the structure are about controlling costs and revenues by source. This allows you to see at a glance which type of cost or revenue generates the most value for your project. The second chart visualises the project in great detail. It indicates which stage or board generates the greatest financial values. Each colour will automatically be assigned to a project section, and you will thus see which stage is worth focusing on in terms of controlling costs or expected earnings.We are convinced that the new financial charts are a quantum leap in data analysis for you and your team. Give us feedback on what you think of the charts!
Control temporal project deviations in Gantt charts in ICP. Compare planned dates with actual dates. ?
Project deviations is a total new functionality in IC Project. It allows you to verify the chart at any time against the current schedule. It is a functionality that you will find of course on the Gantt chart inside any project. All you need to do is go to the project and then click on the 'Gantt' tab. Then glance at the top right corner of the chart and the first icon on the right. When you hover over it, it will be the 'Project Deviations' option.

To use this option effectively, you can create a stamp at any time. For example, at the beginning of a project, after the first month or at an important milestone. You can then overlay each bounce onto the current schedule and catch real project deviations. Deviations are shown in orange, which you will always see on the basis of the current Gantt chart. You can create any number of so-called project photographs and thus catch real project inconsistencies. This is of great value in controlling the project schedule.Project deviations also appear on the Gantt chart for all projects and are enabled by default as an orange colour. To get to this option, click on the 'Projects' tab on the left menu and then look at the option to display projects in the top right corner. At most on the right you will find 'Gantt View'. Each project, when it is added, has set planned dates - start and end. The planned dates are stored in the project at all times (you will see them, among other things, on the top project bar when you hover over the information icon). If you wish, you can edit the project and change the planned dates at any time. The key thing, however, is for them to match your project reality, because then you will catch a significant project deviation. You will see the colour orange on the schedule for all projects, and it will signal a project within the planned scope. You will instantly see potential inaccuracies with the blue colour, which signals the actual dates calculated today from the project schedule.
A support centre for everyone accessible from the IC Project system! Take advantage of our multitude of educational materials. ?
We regularly work on the maximum amount of educational material regarding the IC Project. Why? Because we care about you as much as we can. We want every IC Project user to be able to get instant help with the materials available. We have created user manuals with explanations of every issue and built new video tutorials.We have implemented a support centre in the system, which allows you to immediately make use of the extremely comprehensive IC Project user manual. In it, you will find answers to almost every technical question about the system. In addition, there are numerous video tutorials at your disposal, in which we transparently discuss the most important issues concerning IC Project. There is no need to search, just click on the corresponding icon in the bottom left corner of IC Project during your daily work and you will immediately receive dozens of thematically adapted educational materials.All educational material is available in two languages - Polish and English. From the help centre located in the bottom left corner, you can also instantly arrange a technical consultation, system demonstration or simply chat to our efficient support department. Remember that customer support is our priority, so you can always contact us directly and ask for help.
Add tasks faster and more efficiently from anywhere in the system. Take advantage of additional capabilities to work more efficiently.?
Add tasks faster and more efficiently from anywhere in the system. Take advantage of additional capabilities to work more efficiently.Adding tasks is one of the most common activities you do in IC Project. We know this, and to make your job easier, we've made a big change. You will already find buttons to add a task on all task views. Go to your tasks, all of them, or to the summary view in the project environment. You will even find the option to add a task from the top menu (+) to do it quickly and efficiently.
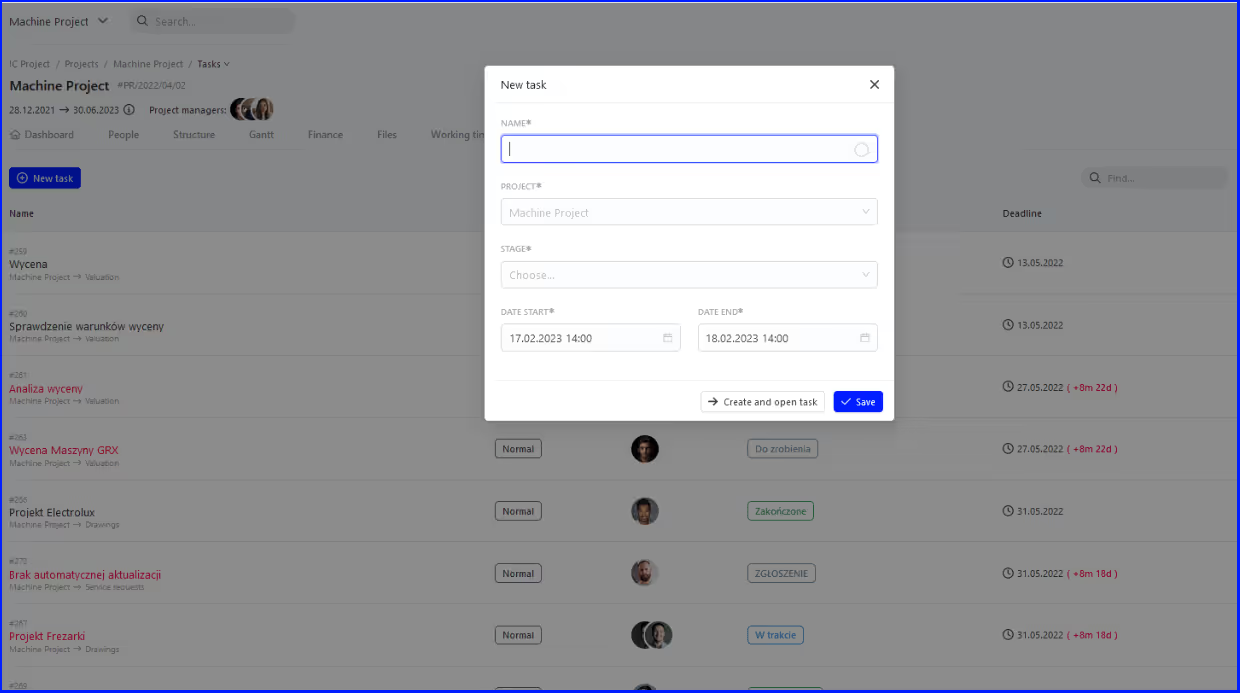
You no longer have to search for a project or go to the task table at the start of a project. As long as you are on a view that deals with tasks, you will also find a button to create such a task there. Of course, the system will ask you about the key conditions of the task, but this is important in order to keep your work organised at the highest level. That's what it's all about in the end, isn't it?As you can see, there is a lot going on with us. We are introducing a lot of important features based on your feedback. We are working on more updates all the time. We'll reveal that in February alone we're planning a lot of exciting features and... integrations. ? We can't wait, and you probably can't wait too. Oh, we'd forget. In January we also published a totally new website. We won't show it to you, because if you read our post, you're practically on it. Go to the top menu or simply click on the logo located in the top left corner. We are very curious what you think of our visual change for the website.
Also read
Update 06.2026 – communication and finance at an even higher level
Discover the June IC Project update featuring a full messenger view, contextual message search, and full KSeF integration to improve communication, project management, and financial workflows.

Marketing Plan - Definition, Examples, and Applications
What is a marketing plan? Check out the definition, examples, and learn how to develop an effective marketing strategy step-by-step.

Update 05/2026: Greater project flexibility, more powerful automations and streamlined communication
What's New in IC Project – May 2026. Check out the new project types, advanced process automations, and the message pinning feature, all of which enhance project management efficiency.
Try IC Project in your company Our team is ready to help!

Create a free account and test with no obligation