May has brought updates to IC Project that will make project management significantly easier. We have introduced changes that won’t only improve the efficiency of your work, but also add creativity and automation to your daily tasks. In this article, you’ll discover how the visual board in the task description editor, the expanded capabilities of the Gantt chart and the new description option with project deviations can become game-changers in your daily work. Take a look at these new features that are sure to transform your approach to project management!
We have a visual board in the description editor of each task
May started with the introduction of a super new feature to IC Project – a visual board in the description editor for each task. This is a functionality that allows you to create amazing visualisations, graphs, mind maps, notes and much more. The only limitation here is your imagination and creativity. This feature is something completely new in IC Project that can dramatically change the way you work on projects.

To use the visual board, all you have to do is go to the assignment, enter the edit description and click on the board icon, located on the right hand side in the text edit menu. Once the board is open, you have the ability to add shapes, make connections, write text, attach graphic files, colour and transform the board into whatever you fancy. Your graphic project will automatically be saved in the task description and in the files tab at the task and whole project level.
This solution is ideal for enhancing task documentation and transforming your own thoughts into graphics. The visual board brings a new quality to project work, enabling a more creative and efficient approach to task management.
Discover a real game-changer in Gantt chart project management
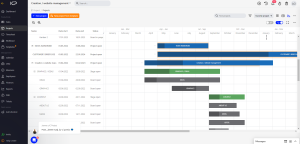
In May, we introduced a feature in IC Project that is a real breakthrough in Gantt chart project management. Now users can expand each project in the portfolio to see its detailed schedule in the context of all ongoing projects. With this feature, it is possible to monitor progress and plan resources more precisely in real time.
To use this feature, simply go to the project module and select the Gantt chart view for the projects shown. All projects in the current portfolio will then appear on the timeline and you will see an arrow icon next to each project. Click on the arrow to expand the detailed schedule of the selected project, allowing you to analyse and compare its progress with other projects.
This solution is particularly useful for project managers who need to keep track of multiple tasks simultaneously and make quick decisions. The ability to develop the schedules of multiple projects at once helps to better understand the relationships between them and to identify potential problems or delays. This innovation significantly improves project management, allowing tasks to be planned and executed more efficiently.
Task dependencies are already available on Gantt charts
Task dependencies are already available on Gantt charts in IC Project. This is a new solution that allows you to automate all task work, especially when managing tasks with complex time relationships. At the level of each task, you can set any dependency, be it waiting or blocking. Now, the entire dependency module has been linked to the Gantt chart, enabling even better project management.

To use this feature, find the Gantt chart schedule on the top project menu or to the right of the Kanban board. Click on the appropriate icon to open the schedule, then set blocking and waiting dependencies for any number of tasks. Each dependency set from the chart will also appear inside the task, automatically updating the schedule and other tasks.
If you have tasks that have dependencies on other items to be completed, be sure to use this module. Task dependencies on Gantt charts in IC Project is full automation in task work, allowing you to track project progress and respond to changes in real time.
We have an additional option for description with project deviations
We have introduced a new feature that makes it significantly easier to manage project reflections in the Gantt chart. You can now add descriptions to each project deviation, allowing you to better understand the significance of the moment for the project. This feature gives you the ability to document and analyse changes to the project schedule more accurately.

Each description will be displayed by hovering over a special icon next to each added reflection or by editing the reflection itself. This makes it easy for you to identify important points in the project and understand the implications for the project. The new feature is another step in streamlining the project management process in IC Project. We hope it will help you to organise your project work even better and respond effectively to schedule changes.
May in IC Project brought a number of new features that significantly improve project management. The introduction of a visual board in the task description editor allows for creative documentation and visualisation of ideas. New features in the Gantt chart, such as task dependencies and the ability to develop detailed project schedules, offer more advanced tools for monitoring progress and planning. In addition, the option to add descriptions to project deviations enables more accurate analysis and a better understanding of key moments in a project. These new developments aim to make project management even more efficient and intuitive, saving time and increasing productivity.